Introduction
Dynamic marine processes and significant coastal erosion characterize the coastal region near Ujung Pangkah in East Java. Since no direct measurements have been made recently, remote sensing techniques effectively monitor these rapid changes, which are primarily driven by the interplay between wave energy, sediment supply, and seasonal variability.
From a geological perspective, the region’s coastline is influenced by a complex underlying structure, as detailed in the technical paper by Awang et al. (2004) as follows:

Tectonic movements alter coastal gradients and energy, altering sediment transport and deposition. Thus, coastal dynamics may be affected by erosion or silt deposition near fault zones. Landsat images are used to study shoreline changes over four years. Advanced shoreline delineation methods like band ratio analysis and edge identification create a robust coastal morphology time series. The analysis uses demographic data to understand human impact on coastal dynamics. Coastal conditions may be affected by possible disaster incidences, household counts, occupational profiles, and total population trends. Population density or occupancy changes may enhance hazard vulnerability or coastal development, altering sediment movement and stability. Remote sensing and demographic data improve our understanding of Ujung Pangkah's coastline and influence coastal management policies, fostering resilience and sustainable development in East Java.
Problem Analysis
The problem analysis utilized the Fishbone approach to compile the project selection to identify criteria problems related to the coastline changes analysis.

Solutions
The current solutions applied to this project study are divided into four parts, including:
- Data Ingestion from External Resources.
It will consume and collect raw data from the USGS Landsat Satellite Imagery dataset and store it in the local database.
- Apply data processing based on Tasseled Cap Transformation.
Currently, the scientific approach is applied to measure the coastline from satellite imagery in a GIS desktop application.
- Utilize GeoMapid, SINI, and Insights as Cloud Apps
Adding new information generated from the GeoMapid application can be beneficial for obtaining demographic information or identifying possible disasters that usually occur in the study area.
Data Composition
The study's data composition is divided into two types: spatial data and non-spatial data. The spatial data is satellite imagery from Landsat 7 (for data in 2001-2002) and Landsat 8-9 for 2024. In addition, the demographic of the Gresik area is also added. As for non-spatial data, information on geological areas and news within the study area is used to understand the changes in the environment near the study area.

Processing
Satellite image processing includes geometric correction, color composite, interpretation, and the production of line maps and image maps. The software used in the satellite image processing is ArcGIS Desktop 10.8.

Before the analysis begins, the satellite images used have been confirmed to have the same datum and projection. The main steps in analyzing shoreline change monitoring from satellite imagery are as follows:
- Calculating the Normalized Difference Vegetation Index (NDVI)
- Calculate greenness, brightness, and wetness using Tasseled Cap Analysis, a technique that optimizes data visualization for vegetation and land/water discrimination.
- The process generates land and sea categories using advanced clustering methods - specifically Dendrogram and IsoClus algorithms - which help differentiate between terrestrial and marine areas.
- The final stage involves data cleaning to refine and validate the extracted shoreline information, ensuring the accuracy and reliability of the final output
Analysis

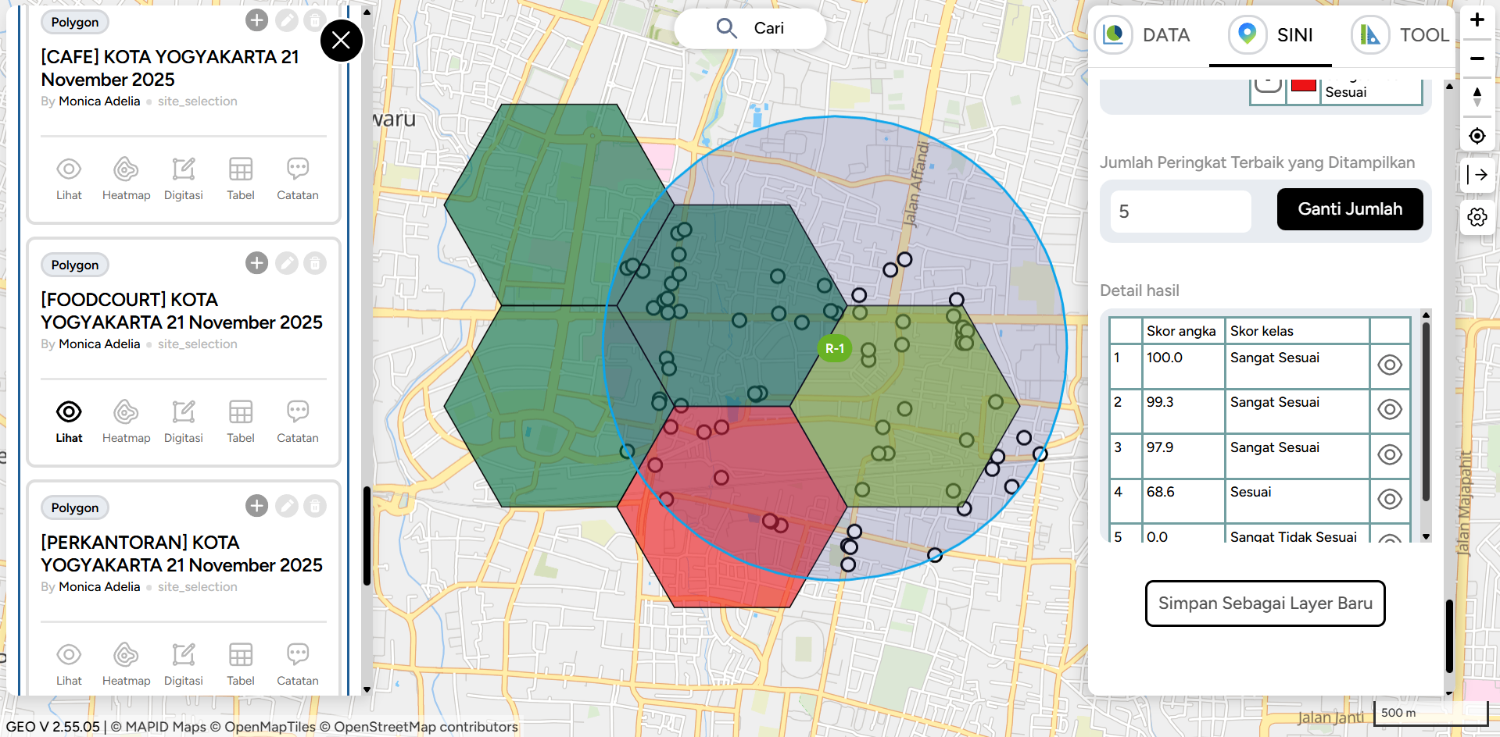
In Gresik, population mapping reflects sophisticated interaction among disaster hazards, people distribution, and beach trends. From "Sangat Rendah," (Very Low), to "Tinggi," a color grid system ranks population density. The study makes use of real demographic data gathered within lone green grid cells representing low population densities. Restricted data limits demographic study and catastrophe preparation within the region.
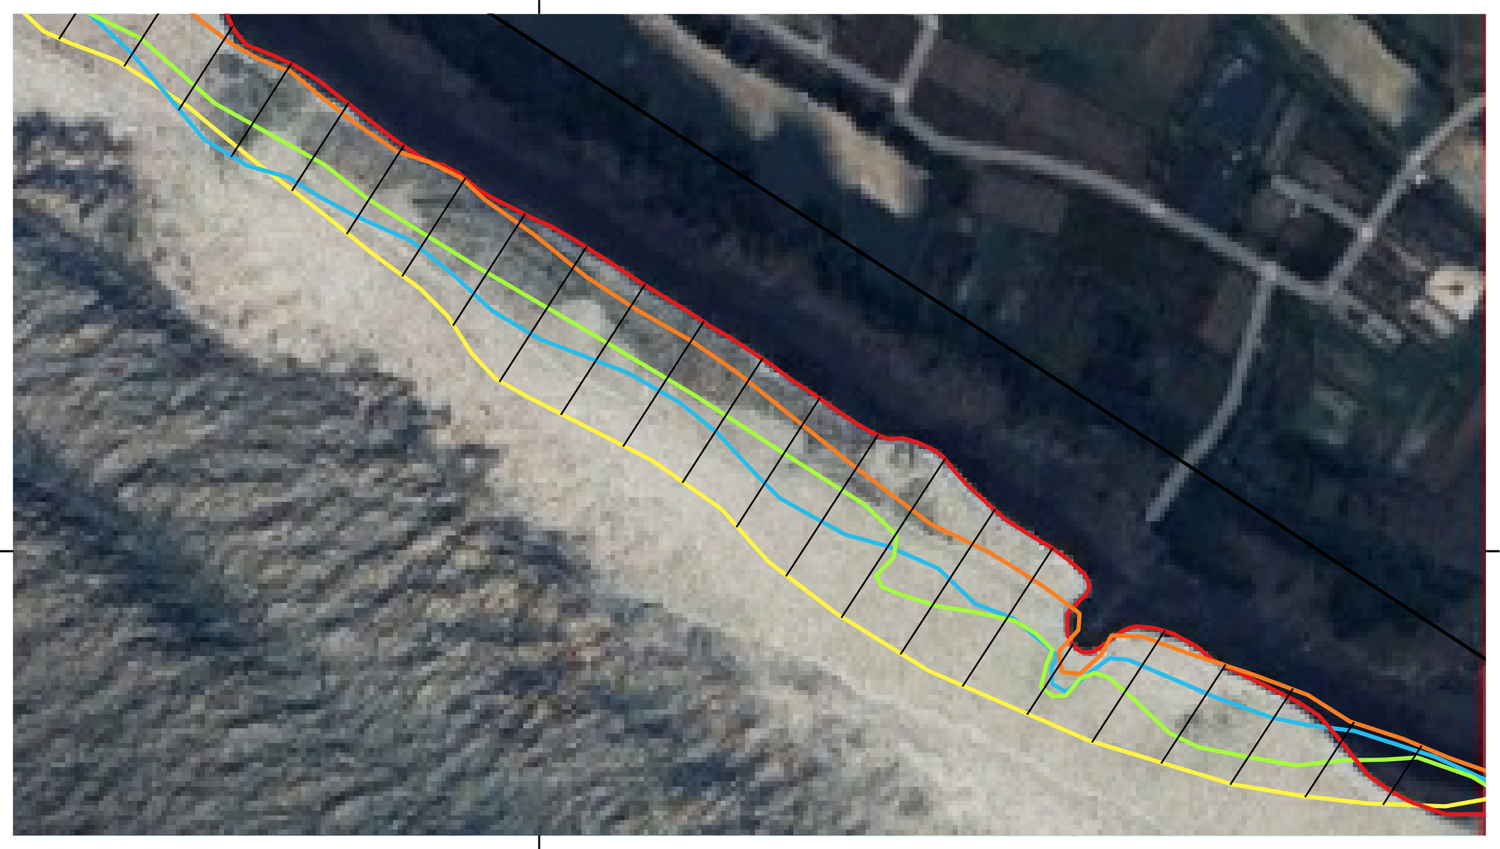
Between 2001 and 2024, shoreline design reflects massive coastal dynamics in Gresik. For these years, different shoreline data show continuous coastal activities including natural erosion and accretion, sea level changes, man-made coastal extension, and even land subsidence. Because of maritime hazards, changes in shoreline form destroy coastal towns and buildings.
Though the interface lacks data ("Tidak ada data"), the tsunami risk layer shows the coastline's susceptibility of the area. Given this susceptibility, one should be concerned about Gresik's shoreline and position. Dynamic shoreline changes and prospective disaster hazards call for an evaluation of complicated risk terrain in urban design and disaster response tactics.
Changing shoreline features or coastal risks could have caused settlement to move inland. Inability to get population estimates for coastal municipalities hinders risk assessment and emergency preparation.
These numbers imply that Gresik has some quite basic needs. Particularly around the seaside, complete demographic data collecting will help to better estimate catastrophic risk management.
Conclusion
The results of the analysis of the coastal map of the Ujung Pangkah area derived from satellite imagery showed significant changes, both in the coastline and its area. The coastal erosion or accretion area has not yet been quantified, but we can find the difference from the four-year period (2001, 2002, 2003, and 2024). New land changes occurred in the Ujung Pangkah, and combined with INSIGHTS demographic data, the area is far from the household, which is a good indication that the land can be used for ponds and mangrove forests.

![[GEODATA] Tutupan Lahan Indonesia](https://mapidstorage.s3.amazonaws.com/general_image/mapidseeit/1684312961161_COVER%20GEODATA_%20Tutupan%20Lahan.png)
![[GEODATA] Status Ekonomi dan Sosial (SES) Indonesia](https://mapidstorage.s3.amazonaws.com/general_image/mapidseeit/1693454652933_20230831-085941.jpg.jpeg)
![[GEODATA] Point of Interest (POI)](https://mapidstorage.s3-ap-southeast-1.amazonaws.com/foto_doc/mapidseeit/doc_1648452337_d8074cde-5aef-4820-88ba-b6cc500a7e04.jpeg)