Introduction
Urbanization trends have become a global issue, leading to the emergence of slum settlements characterized by high population density, poor building quality, and limited access to facilities and infrastructure, adversely affecting residents' quality of life (Bhattarai & Budd, 2019; (Abdel-Rahman et al., 2023). Contributing factors include rapid urbanization, economic disparities, and inadequate urban planning and housing policies (Anierobi et al., 2023). Additionally, slums are often located in disaster-prone areas, such as those susceptible to flooding and landslides, further exacerbating living conditions (Wolff & Ramírez-Lovering, 2022).
In Indonesia, the Ministry of Public Works and Housing Regulation No. 14 of 2018 defines seven criteria for slums: (1) building condition, (2) neighborhood roads condition, (3) drinking water supply condition, (4) neighborhood drainage condition, (5) wastewater management condition, (6) waste management condition, and (7) fire protection condition. In Central Java, slum areas covered 8,724.720 hectares in 2022, presenting significant challenges for urban development. Demak Regency, as designated by Demak Regent's Decree No. 475.26/120 of 2021, has 16 slum areas across three districts: Demak, Mranggen, and Sayung, with a total area of 211.602 hectares. The worst slum conditions are in Sayung District, exacerbated by coastal tidal flooding that degrades the quality of settlements. The increased frequency of coastal flooding leads to infrastructure damage and environmental degradation. Settlements in coastal areas often become slums due to abrasion and inundation, as seen in Sayung District. In 2021, Sayung District had a population of 105,525 with 11,772 residents live in slum areas according to the Final Report on the Preparation of the RP2KPKPK Document for Demak Regency.
Conventional mapping of slum settlements in Indonesia is typically conducted by the government through field surveys. These methods often have significant temporal gaps and are less effective in capturing the dynamic and evolving nature of urban environments and slum areas. To date, there has been no attempt to utilize remote sensing data processing for the identification of slum areas in Indonesia, marking a novel approach in this study. High-resolution satellite imagery and geospatial data allow for more efficient spatial, temporal, and spectral analysis of slum settlements compared to field surveys. However, obtaining reliable and accurate data is hindered by the heterogeneity and complex spectral characteristics of urban land and the diverse morphology of slum settlements (Stark et al., 2020).
This research integrates multi-source remote sensing datasets processing methods based on cloud computing with Geographic Information Systems (GIS). Considering that urban areas have heterogeneous and complex spectral characteristics, texture analysis techniques, such as the grey level co-occurrence matrix (GLCM), integrated with spectral indices like the normalized difference water index (NDWI), soil-adjusted vegetation index (SAVI), and normalized difference building index (NDBI), are expected to improve class separation and identify morphological variations of slum areas using GEE (Matarira et al., 2022). Slum area classification and morphological variation identification are then performed using the random forest algorithm to obtain a more detailed, accurate, up-to-date, and objective analysis of slum areas, including their dynamics and morphological characteristics.
Research Methodology
Study Area
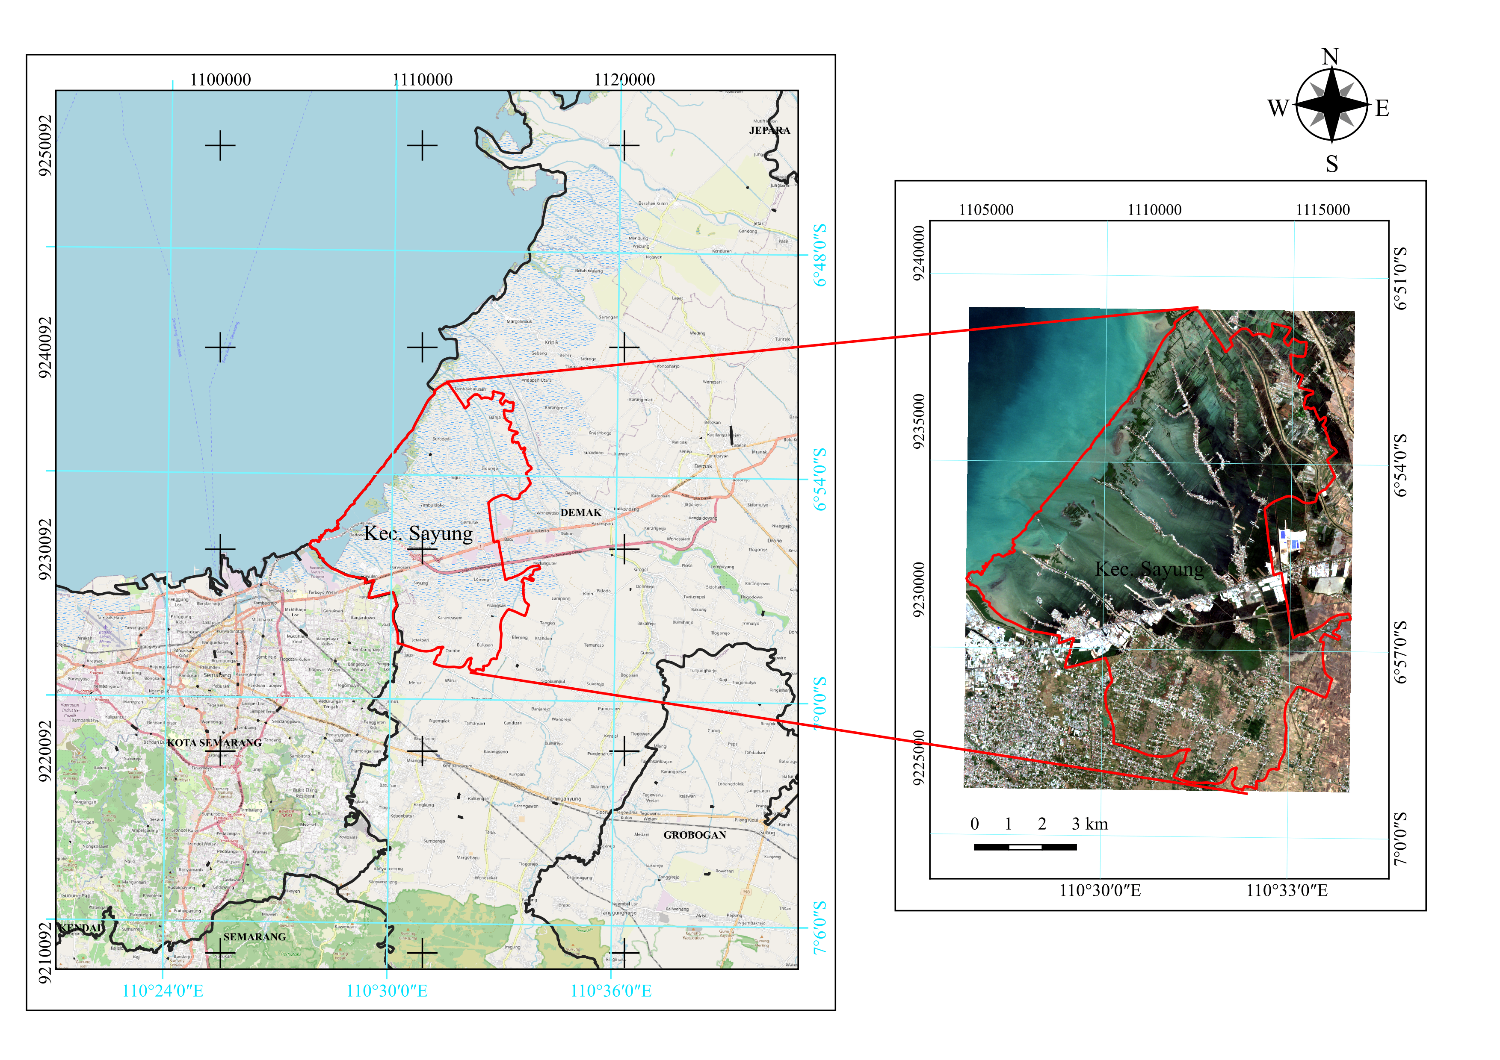
Figure 1. Map of study area, Sayung District (a) within Demak District (a) the RGB overview of the Sentinel 2A imagery, in UTM/WGS84 plane coordinate.
The study area is focused on Sayung District, located in Demak Regency, Central Java, Indonesia. Geographically, Sayung District lies between 6°53'31.4" - 6°57'08.2" South Latitude and 110°31'33.2" - 110°48'47" East Longitude, positioned on the northern coast of Java, bordered by the Java Sea to the north, Mranggen District to the south, and Semarang City to the west. The district covers an area of 8,602.927 hectares, consisting of 20 villages. Sayung District had a population of 105,525 in 2021, with a growth rate of 2.02% and a sex ratio of 102.80%. Approximately 11,772 residents live in slum areas characterized by high population density, inadequate housing quality, and limited access to basic services such as sanitation and clean water. Its coastal location makes it particularly vulnerable to tidal flooding or "rob," significantly impacting the quality of life and settlement conditions.
Data
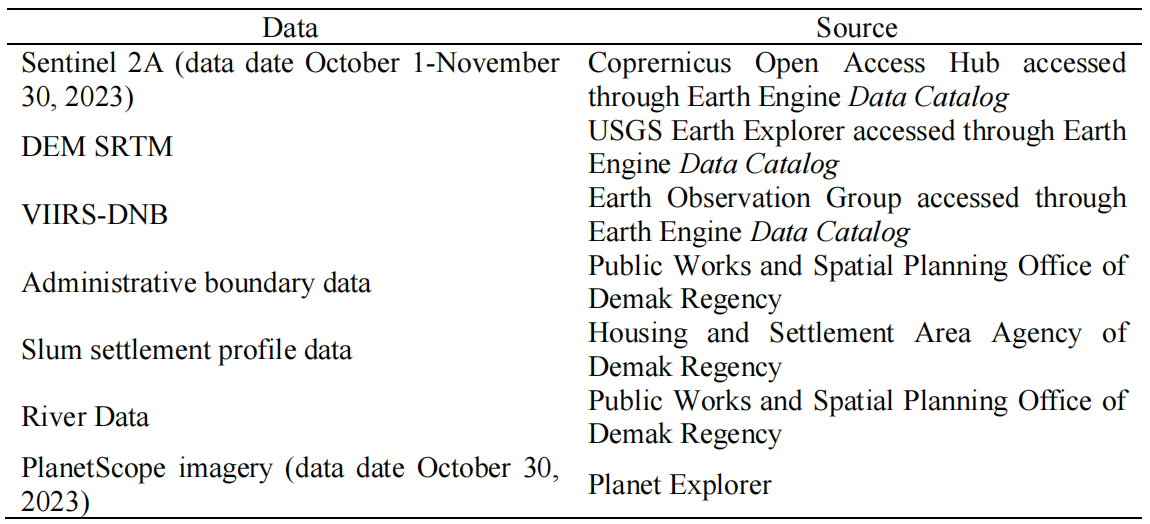
A diverse range of datasets is utilized to conduct a comprehensive analysis of slum areas in Sayung District, Demak Regency. The data used in this research, as shown in Table 1, includes secondary data that is openly available (open source) and obtained from relevant ministries or agencies. The primary datasets include high-resolution satellite imagery from Sentinel-2A, DEM
.
Table 1. Data source
Methods
The methodology employed in this research integrates advanced remote sensing techniques with cloud computing to identify and analyze slum areas in Sayung District. The flowchart of this study is shown in Figure 2. Data from DEM SRTM, Sentinel-2A imagery, VIIRS-DNB, and administrative boundaries are preprocessed and integrated with slum settlement profiles for analysis. Sentinel-2A images, selected with less than 5% cloud cover during the dry season for optimal visibility, are filtered and composited using GEE to create a median image. DEM SRTM data is obtained and clipped to the study area, while VIIRS-DNB nightlight data is filtered and composited to provide a stable representation of nightlight intensity. Textural features are extracted using GLCM, and spectral indices are derived from Sentinel-2A imagery. These features, combined with elevation and nightlight data, serve as input for supervised classification using the random forest algorithm. Training and testing samples build and validate the model, which identifies slum areas for morphological analysis focusing on building density and typology. The results are validated through expert judgement analysis with the Housing and Settlement Area Agency (DINPERKIM) and field observations.
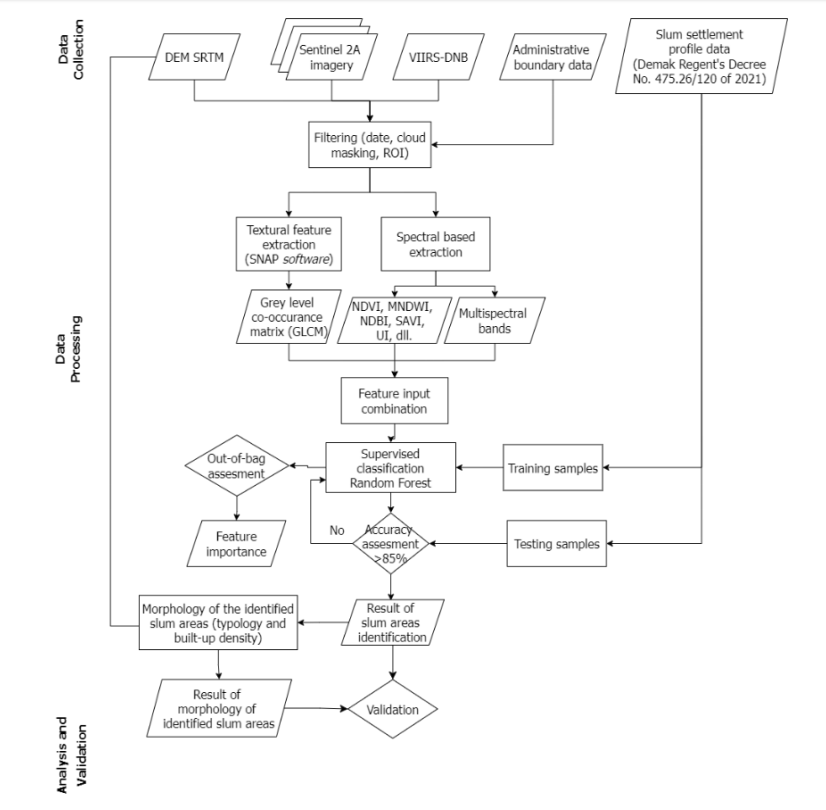
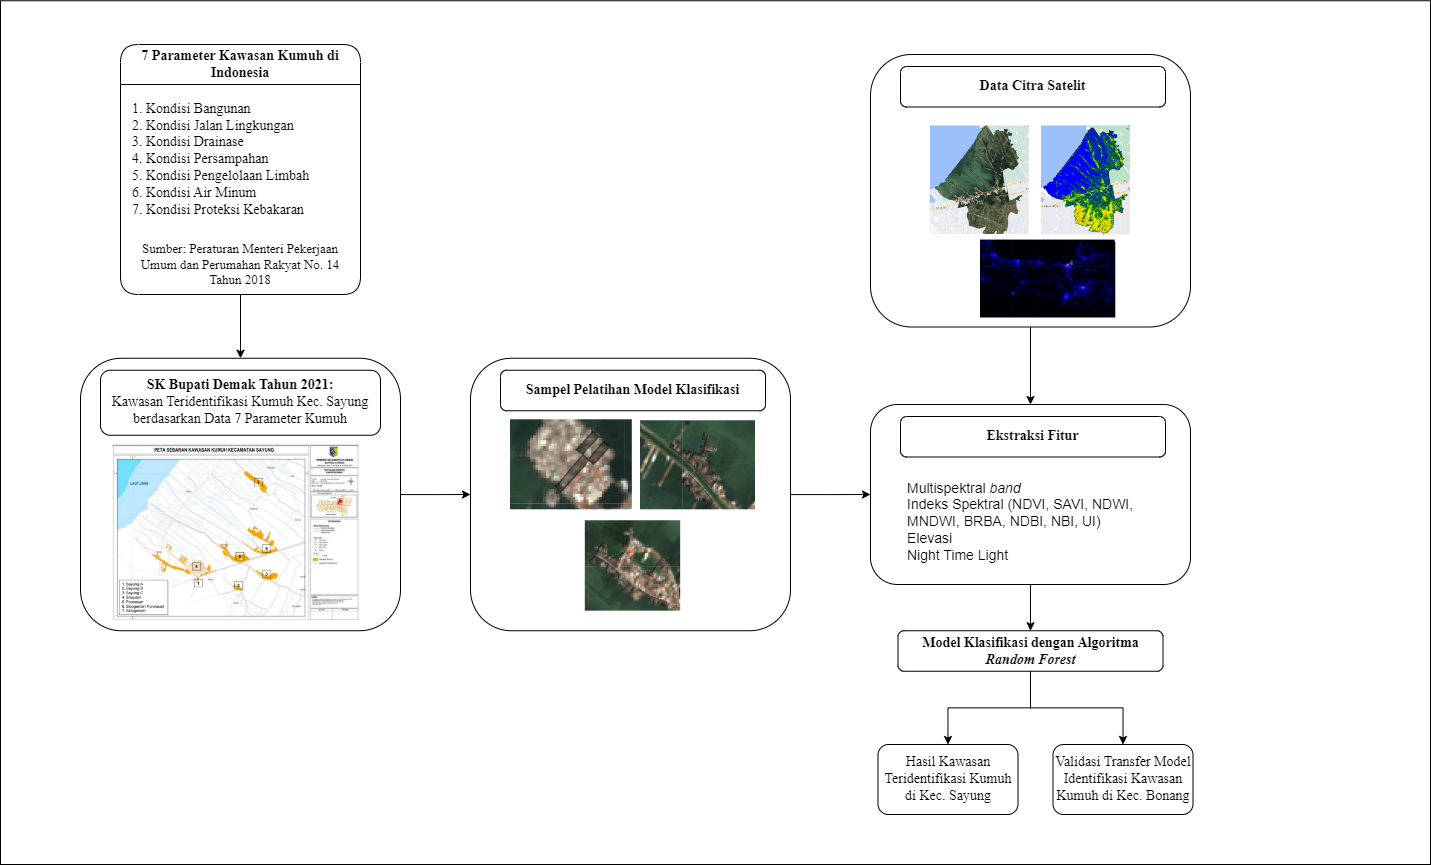
Figure 2. Research workflow chart
Feauture Extraction
Specific features are extracted from each dataset. From Sentinel-2A imagery, 10 spectral bands (B2, B3, B4, B5, B6, B7, B8, B8A, B11, B12), 8 spectral indices (NDVI, NDWI, SAVI, NDBI, UI, NBI, BRBA, MNDWI) that are computed from spectral band ratio, and 32 texture features are derived using the Grey Level Co-occurrence Matrix (GLCM) from bands B2, B3, B4, and B8 including mean, variance, homogeneity, correlation, entropy, dissimilarity, contrast, and angular second moment, which help in distinguishing different textures and structural patterns within the slum areas (Montero et al., 2023). The literature that is currently available on large-scale land cover mapping frequently uses spectral indices. They are founded on in-depth understanding of the recognized traits of several land cover classifications, including urban areas, vegetative, and water body (Li et al., 2020). The mathematical equations for the band ratios of the spectral indices used in this study are shown in Table 2. DEM SRTM provides elevation data, while VIIRS-DNB the selected band is 'avg_band' which represents the average nighttime light intensity and applies the median reduction function to create a composite image. This process reduces noise and results in a more stable representation (Ji et al., 2020).
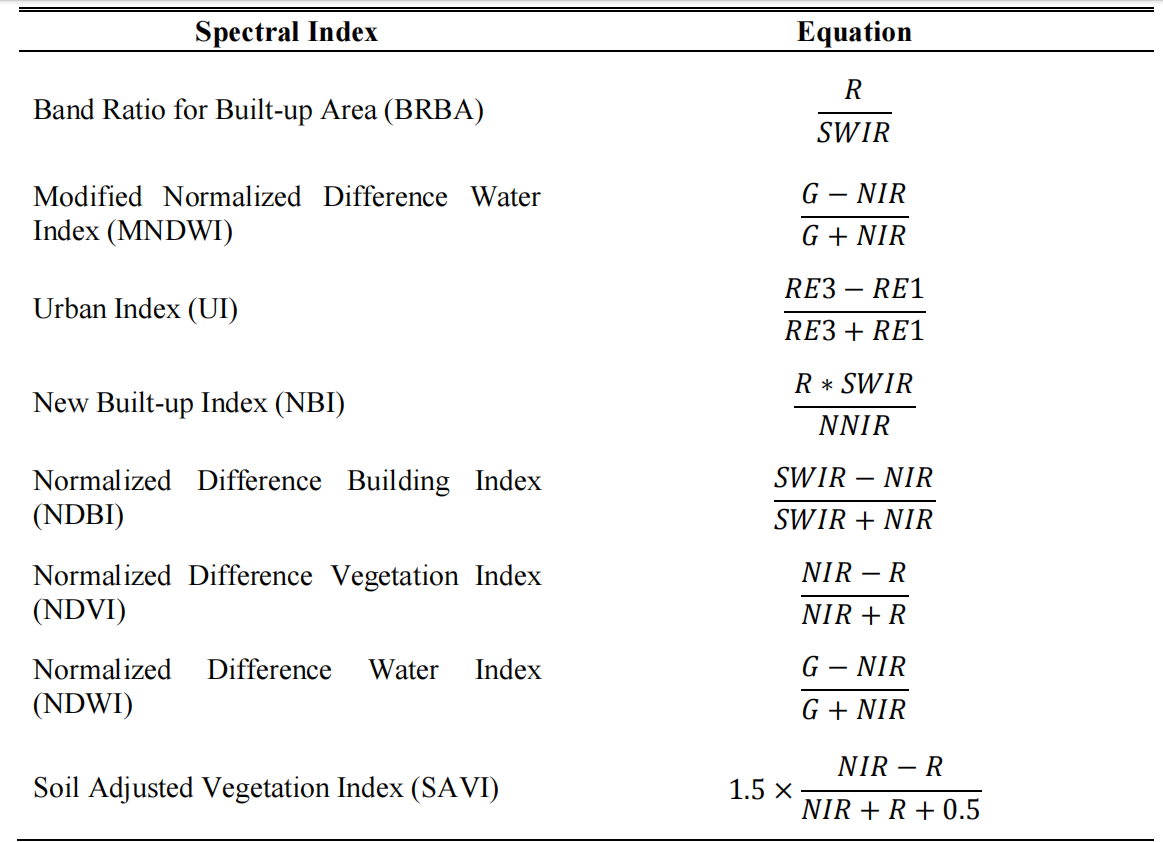
Table 2. The 8 indices in the spectral wavelength 559.8-1613.7 nm used as input features (R: Red; G: Green; NIR: Near Infrared; NNIR: Narrow Near Infrared; SWIR: Short wave infrared (Band 11); RE: Red edge).
Texture Analysis with GLCM
GLCM features are based on the joint probability distribution of pairs of pixels at a certain distance and direction in an image. This can measure different texture properties with various parameters, such as energy, contrast, homogeneity, entropy, correlation, etc. of image pixels associated with different land uses or cover types (Mohammadpour et al., 2022). Texture analysis with GLCM in this study is performed using SNAP software. The analysis included mean, variance, homogeneity, correlation, entropy, dissimilarity, contrast, angular second moment from bands 2, 3, 4, and 8. Optimum parameters for GLCM included a window size of 7x7, quantization level 64, and displacement 1 (Betreuer & Drtechn Josef Jansa, 2019).
Random Forest Classification
A variety of automatic classification techniques for classifying land cover including support vector machine (SVM), random forest (RF), and maximum likelihood classification (MLC) can be performed in GEE (Zhao et al., 2024). In this study, the chosen supervised classification method for slum areas identification in Sayung District is RF classifier which offers benefits in speed and flexibility when working with big datasets (Magidi et al., 2021). The algorithm is trained with known samples from the existing slum settlement profile data to develop a model that can accurately identify slum areas based on their spectral, spatial, and textural characteristics. The RF classification method employed in this study involves several key parameters and settings to ensure optimal performance.
Training samples were selected as small polygons to guarantee that a polygon comprises homogeneous pixels of a particular land cover and that the effects of spatial correlation are minimized (Wei et al., 2023). 104 training samples and 44 testing samples were used for the classification. The model was designed to use a random sampling strategy to generate approximately 70% of the training samples from the original datasets, creating a decision tree for each training sample individually, and the remaining 30% of the training samples were used as validation data for internal cross validation to assess the random forest's classification accuracy. In addition, the land classification scheme proposed five land cover classes that characterize the study area landscape. These include slum settlement, vegetation, water body, non-slum settlement, and bare land.
The number of trees in the forest is a critical parameter. To optimize the performance of the random forest model, hyper-parameter tuning is performed. This involves varying the number of trees in the forest (ranging from 10 to 120) and evaluating the model's performance. The optimal number of trees is selected based on accuracy metrics, ensuring the model is neither over-fitted nor under-fitted. The model's performance was evaluated at each step, with 100 trees selected as the optimal number based on accuracy and error metrics, ensuring the model is neither overfitted nor underfitted. The contribution of each feature to the classification process is evaluated. Feature importance analysis helps in understanding which features (spectral, textural, elevation, or nightlight) are most influential in distinguishing slum areas from non-slum areas.
Accuracy Assesment and Validation
The accuracy test technique in machine learning image classification involves comparing the classification results of the model with valid reference data (Martínez Prentice et al., 2021). The accuracy of the classification is assessed using several metrics:
-
1.Confusion Matrix: This matrix compares predicted classes with actual classes to evaluate the model's performance. It includes User Accuracy (UA), which measures the reliability of the model's predictions by indicating the probability that a pixel classified as a particular class actually belongs to that class. Producer Accuracy (PA) assesses the model's ability to capture all instances of a class, indicating the probability that a reference pixel is correctly classified. Overall Accuracy (OA) provides a general measure of the model's performance, indicating the proportion of correctly classified pixels among the total. The F-Score represents the harmonic mean of precision and recall, while the Kappa Coefficient is a statistical measure that accounts for chance agreement between observed and predicted classifications, ranging from -1 to 1, with 1 indicating perfect agreement
-
2.Error Metrics: Error Metrics such as Root Mean Square Error (RMSE) and Mean Absolute Percentage Error (MAPE) are calculated to quantify the prediction errors. RMSE measures the differences between predicted and observed values, indicating the magnitude of prediction errors, while MAPE provides insight into the accuracy of predictions in relative terms, expressed as a percentage.
-
3.Validation: The model's accuracy and generalization are ensured through spatial validation by applying the model to areas outside Sayung District. This involves expert judgement analysis with policymakers from DINPERKIM Demak Regency and comparison with high-resolution PlanetScope imagery and ground-truth data from field surveys. This step checks the reliability and validity of the model's predictions against actual conditions.
Result and Discussion
Identification and Analysis of Slum Areas
The existing slum areas, as determined by Demak Regent Decree No. 475.26/120 of 2021, include several regions in Sayung District. These regions are Sayung A (0.7 hectares), Sayung B (3.27 hectares), Sayung C (10.89 hectares), Sriwulan (17.35 hectares), Sidogemah (14.986 hectares), Purwosari (19.09 hectares), and Sidogemah- Purwosari (17.716 hectares). In 2021, a total of 84.002 hectares were designated as slum areas, housing 9,275 residents. This designation underscores the severe living conditions and the need for targeted interventions to improve infrastructure and quality of life in these areas.
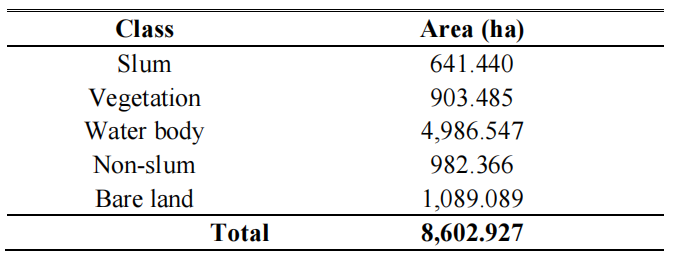
The spatial distribution of slum areas within the Sayung District (highlighted in red) shown in Figure 3 reveals that these areas are predominantly located along the coastal region and adjacent to water bodies. This finding aligns with data and analysis from various sources, indicating that slum areas in Sayung District are significantly affected by tidal flooding, making them highly susceptible to such events. The maps also show that vegetation is relatively sparse in the identified slum regions, correlating with the poor environmental conditions typical of these areas. The calculated area of identified slum in Sayung District, as shown in Table 3, 7.46% of the total area. Additionally, other land cover types in Sayung District were observed as follows: water bodies occupied 4986.547 hectares (57.96%), vegetation covered 903.485 hectares (10.50%), non-slum areas accounted for 982.366 hectares (11.42%), and bare land comprised 1089.089 hectares (12.66%). These area calculations illustrate the diverse land and the need for comprehensive and management strategies to address various environmental and urban challenges.
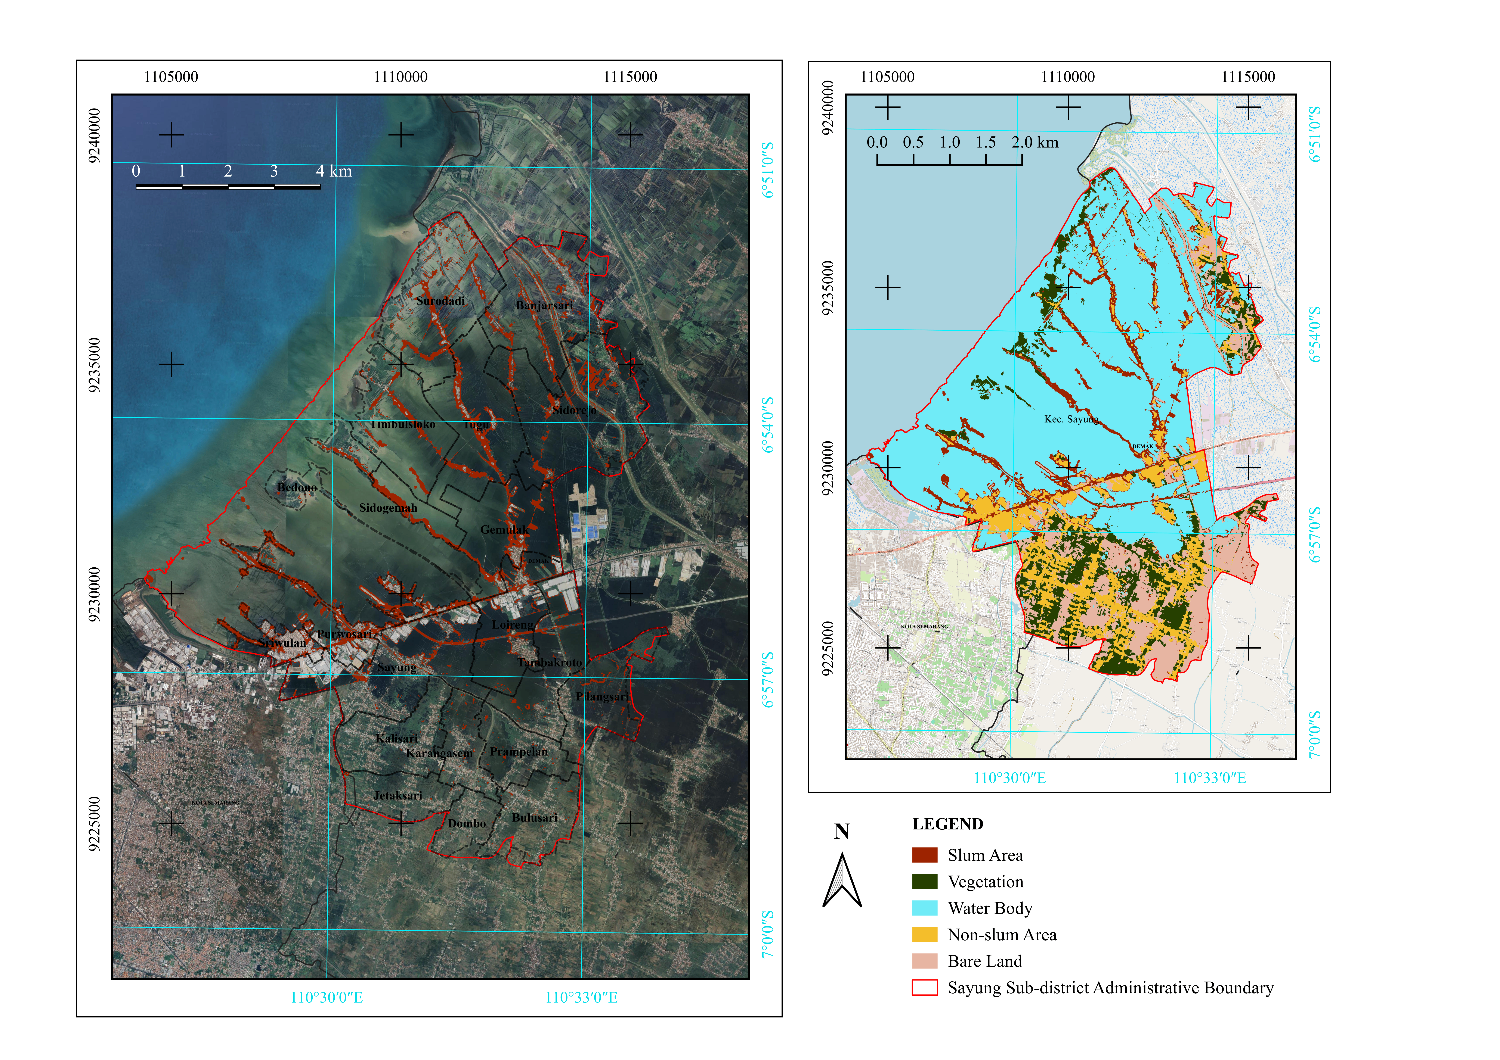
Figure 3. Spatial distribution of identified slum areas in Sayung District from RF classification
Table 3. Area of each class in hectares
Morphological Analysis of Slum Areas
The morphology of slum areas in this study was analyzed based on their geographic location and building density. The DEM (Digital Elevation Model) and river buffer analysis provided critical insights into the geographical and environmental factors influencing slum areas in Sayung District. Elevation data from DEM SRTM, combined with a 50-meter river buffer identified areas at risk of flooding and other hydrological hazards. The determination of the 50-meter river buffer was based on the Demak Regency Regional Regulation, which stipulates that for rivers with a width of 30 to 20 meters, the river border line is 15 meters from the right and left banks. Given that the average width of rivers in Sayung District is 20 meters, a 50-meter buffer was established to adequately capture the areas most susceptible to flooding.
The analysis showed that slum areas are predominantly located in low-lying regions with average elevations between 3.41 to 3.58 meters, making them highly susceptible to tidal flooding. This geographic vulnerability necessitates targeted interventions to mitigate flood risks and improve living conditions. The Normalized Difference Built-up Index (NDBI) values ranged from -0.07 to 0.15, with an average of 0.04, indicating varying building densities within the slum areas. This range suggests densification through new constructions or intensified existing structures. The analysis provides crucial data for urban planners to understand and address slum development dynamics, ensuring informed decision-making for future interventions. A tailored approach to slum upgrading and flood risk management is crucial to address specific vulnerabilities and characteristics of each area.
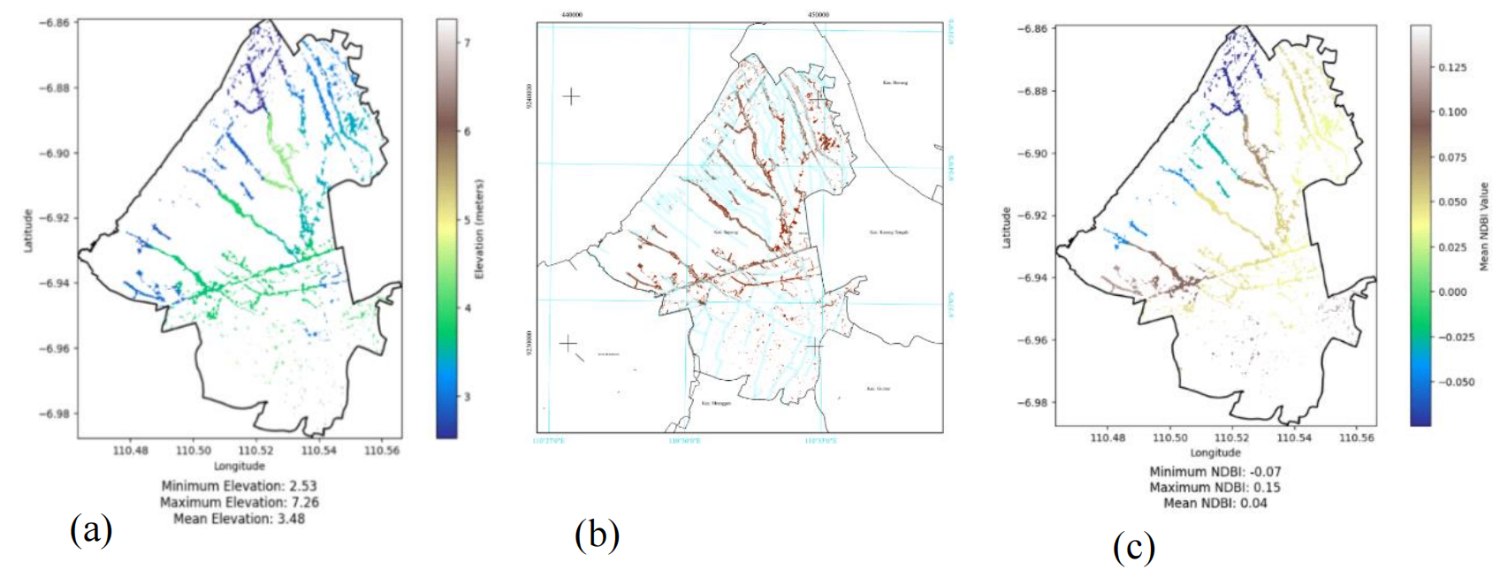
Figure 4. Map of (a) mean elevation (b) within 50 buffer from river (c) mean NDBI of identified slum areas in Sayung District
Accuracy Assessment
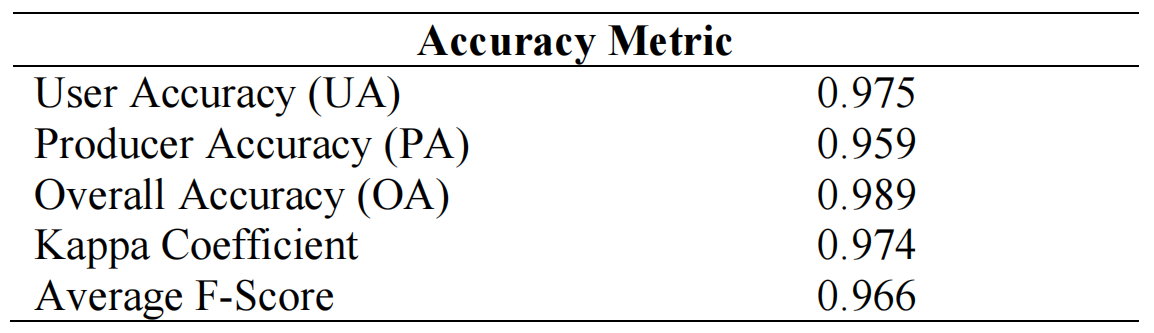
The accuracy of the slum identification model was evaluated using a confusion matrix, yielding several key metrics shown in Table 4. These high accuracy and Kappa coefficient values indicate the model's effectiveness in distinguishing between slum and non-slum areas. The implementation of remote sensing data, combined with cloud computing processing using GEE, has proven to be effective in overcoming the temporal and spatial limitations of conventional slum mapping methods.
Table 4. Accuracy Assessment
Importance of Features for Slum Identification Mapping
Feature importance analysis highlighted the significant input features for the classification model. The VIIRS-DNB feature, which captures nighttime lighting and radiation patterns, had a high importance score, reflecting the irregular lighting distribution typical of slum areas. This indicates that areas with lower nightlight intensity are strongly correlated with slum areas, reflecting limited access to electricity and infrastructure. Texture features such as mean and variance from band 8 (NIR) also played crucial roles, indicating the heterogeneity in building materials and structure within slum areas. These texture features derived from Sentinel-2A bands provide valuable information about the spatial arrangement of pixel intensities, aiding in the accurate classification of slum areas. These insights are vital for understanding the underlying factors contributing to slum identification and improving future models.
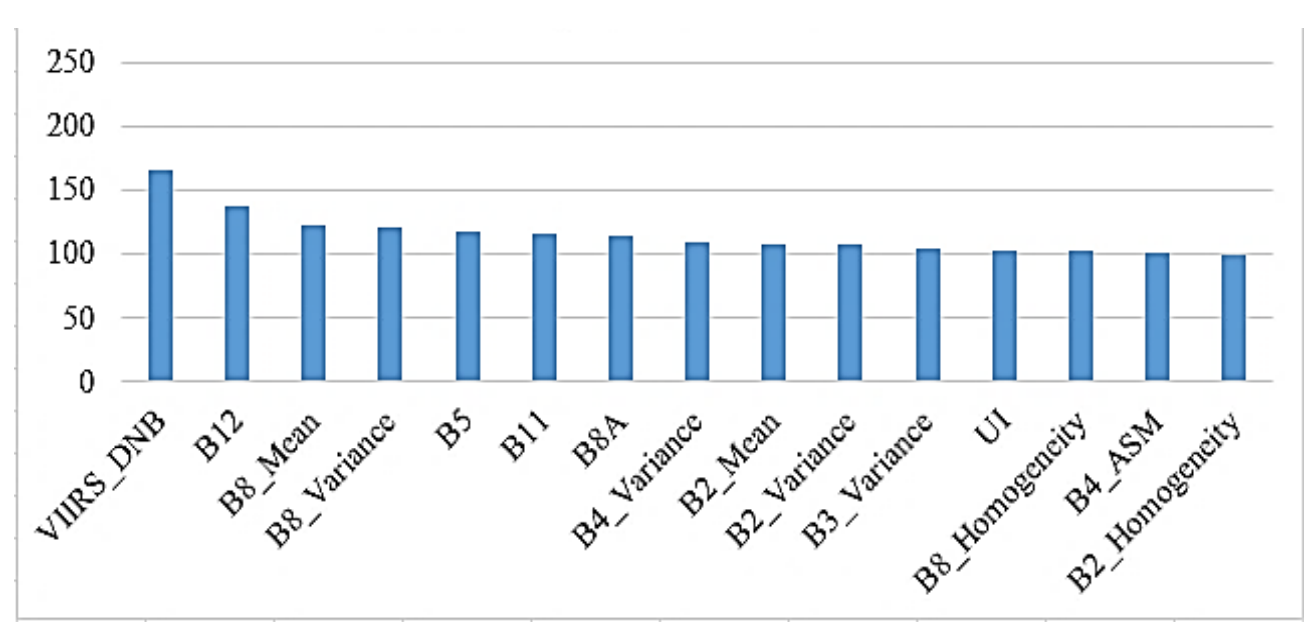
Figure 5. Top 15 feature importance in the classification
Out-of-Bag (OOB) Error Estimation
Out-of-Bag (OOB) error is an internal validation method used in Random Forest to measure model accuracy without a separate validation set. It involves bootstrap sampling, where some training samples are not selected, forming OOB samples. The Random Forest model in this study used 100 trees, with each tree trained on a bootstrap subset, leaving around 37% as OOB samples. The OOB error estimate, calculated as the average prediction error for these OOB samples, was 0.0122. This low error rate indicates strong feature discrimination and good model generalization, suggesting minimal overfitting.
Validation of Classification Results
Validation of the Random Forest (RF) classification results was performed using PlanetScope image interpretation with 90 randomly distributed points representing each class. The confusion matrix and validation metrics showed an overall accuracy of 89.4%, an RMSE of 0.391, and a MAPE of 9.69%. These results indicate good model performance, with high overall accuracy and acceptable error margins. The validation confirms the model’s effectiveness in identifying slum areas, although some prediction errors were noted, which can be further refined in future studies.
Field validation involved evaluating the accuracy of RF classification results against actual field conditions. Observations included environmental conditions, infrastructure, building conditions, and the economic status of the community. The field validation supported the classification results, demonstrating the model's accuracy in reflecting actual conditions.
The qualitative validation performed with expert judgement analysis from DINPERKIM result adds credibility to the quantitative findings, ensuring that the model's predictions align with real-world observations and providing a comprehensive understanding of the slum areas. The positive reception of these findings by policymakers at the Housing and Settlement Area Agency (DINPERKIM) of Demak Regency further emphasizes the practical applicability and significance of the research outcomes.
Transferability of The Classification Model
Transfer validation tested the model's ability to generalize to new areas not included in the training data. The model, trained on data from Sayung District, was applied to Bonang District, which shares similar coastal characteristics. Result shown in Figure 7. The transfer validation results showed an overall accuracy of 99% and a Kappa coefficient of 98%. These results confirm the model's effectiveness in identifying slum areas in new regions, demonstrating its robustness and applicability to other areas with similar characteristics. The high accuracy and Kappa coefficient indicate that the model can be reliably used for preliminary slum identification in different geographic contexts, providing a valuable tool for urban planning and policy formulation.
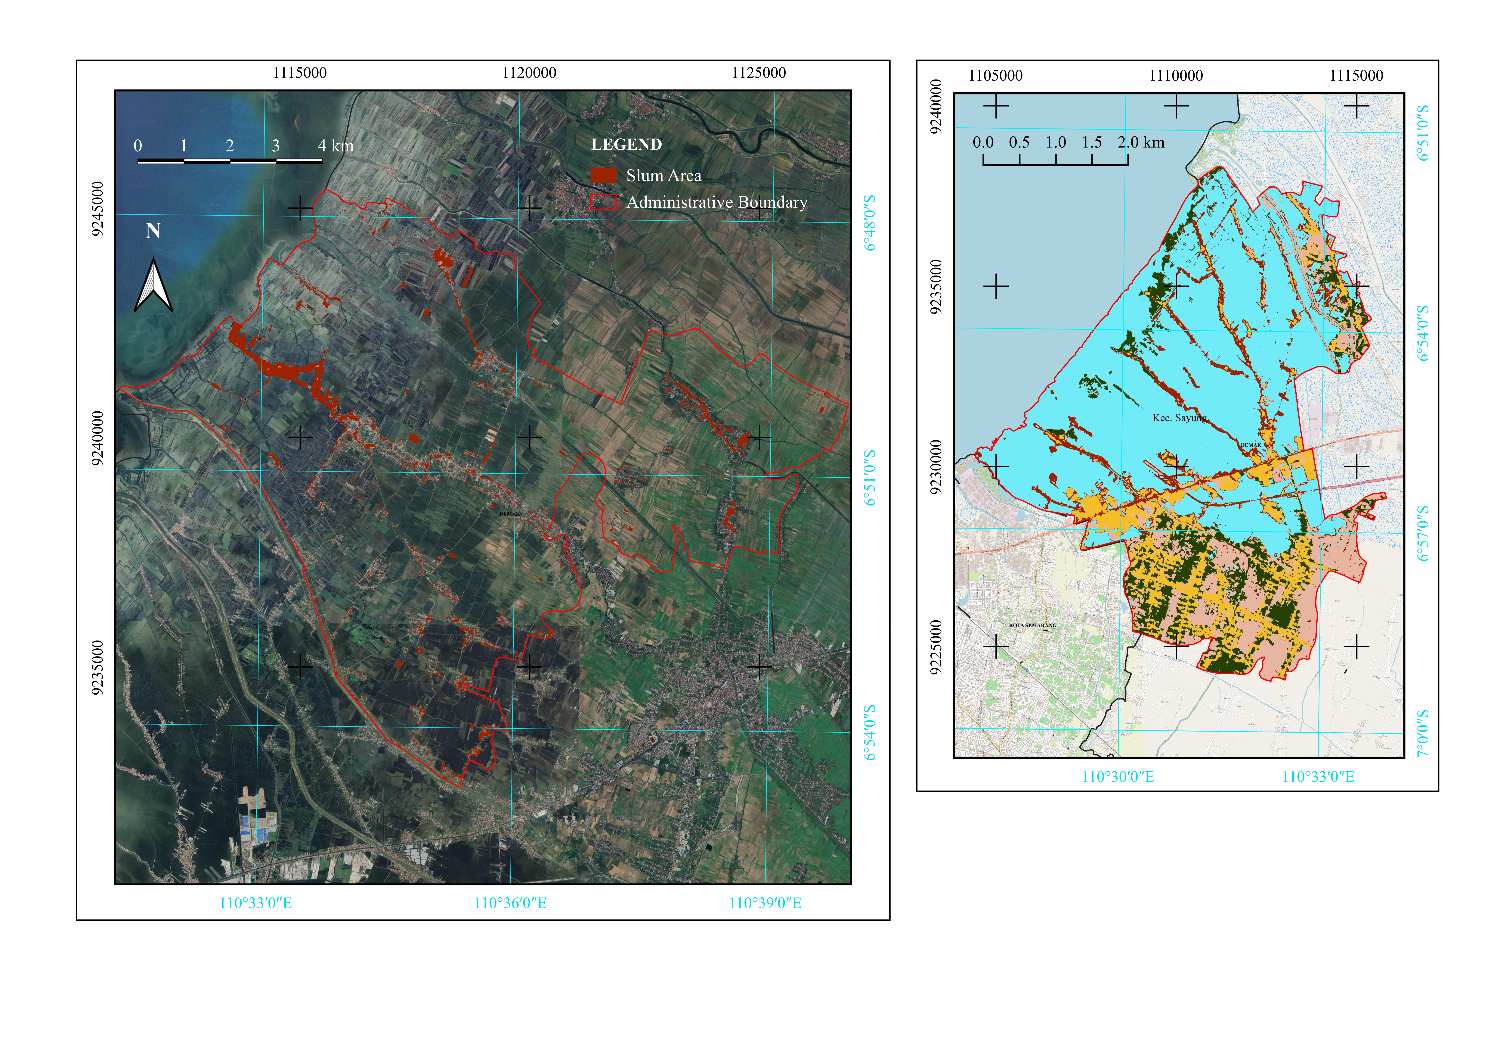
Figure 7. Map of identified slum areas (highlighted in red) in Bonang District for the transferability test of the trained classification model.
Conclusion
This study utilized the Random Forest (RF) algorithm integrating texture analysis, spectral variables, DEM SRTM, and VIIRS-DNB data to identify slum areas in the Sayung District, Demak Regency. The modeling results demonstrated a remarkably high overall accuracy rate of 98.90%, with an F-score of 97%. Moreover, the high Kappa coefficient values (0.985 for 2021 and 0.974 for 2023) indicated significant agreement between the classification outcomes and actual field conditions. The importance of monitoring was evident from the decrease in slum area covering from 728.111 hectares (8.46% of the total area) in 2021 to 641.440 hectares (7.46% of the total area) in 2023. Morphological variations revealed that slum areas tended to be situated in low-lying areas along riverbanks with a risk of flood hazards and exhibited relatively low building density, with an NDBI range from -0.07 to 0.15. Validation analysis confirmed the RF classification model's strong performance in identifying slum areas, supported by quantitative results including an overall accuracy rate of 89.4%, RMSE of 0.391, and MAPE of 9.69%. Transfer validation results showing 99% accuracy and 98% Kappa coefficient underscored the model's reliability in mapping slum areas. Qualitatively, the study successfully represented field conditions, bolstered by positive reception from DINPERKIM regarding the representation of training data and the potential use of the research findings or model for more effective policy planning in addressing slum areas.
References
-
1.Abdel-Rahman, S., Khater, E., & Abdel Fattah, M. N. (2023). Characteristics of Slum Residents in Egypt and Their Critical Existing Problems. Urban Forum, 34(1), 99–132. https://doi.org/10.1007/s12132-022-09470-y
-
2.Anierobi, C. M., Nwalusi, D. M., Efobi, K. O., Nwosu, K. I., Nwokolo, N. C., & Ibem, E. O. (2023). Urban Housing Inequality and the Nature of Relationship Between Formal and Informal Settlements in Enugu Metropolis, Nigeria. SAGE Open, 13(3). https://doi.org/10.1177/21582440231192390
-
3.Betreuer, B., & Drtechn Josef Jansa, D. (2019). Classification of satellite images by including spectral and textural information zur Erlangung des akademischen Grades Geodäsie und Geoinformation Madalina-Iasmina Gaina. http://www.ub.tuwien.ac.athttp://www.ub.tuwien.ac.at/eng
-
4.Bhattarai, K., & Budd, D. (2019). Effects of Rapid Urbanization on the Quality of Life. In Multidimensional Approach to Quality of Life Issues (pp. 327–341). Springer Singapore. https://doi.org/10.1007/978-981-13-6958-2_21
-
5.Ji, H., Li, X., Wei, X., Liu, W., Zhang, L., & Wang, L. (2020). Mapping 10-m resolution rural settlements using multi-source remote sensing datasets with the google earth engine platform. Remote Sensing, 12(17), 1–23. https://doi.org/10.3390/rs12172832
-
6.Li, Q., Qiu, C., Ma, L., Schmitt, M., & Zhu, X. (2020). Mapping the Land Cover of Africa at 10 m Resolution from Multi-Source Remote Sensing Data with Google Earth Engine. Remote Sensing, 12(4), 602. https://doi.org/10.3390/rs12040602
-
7.Magidi, J., Nhamo, L., Mpandeli, S., & Mabhaudhi, T. (2021). Application of the Random Forest Classifier to Map Irrigated Areas Using Google Earth Engine. Remote Sensing, 13(5), 876. https://doi.org/10.3390/rs13050876
-
8.Martínez Prentice, R., Villoslada Peciña, M., Ward, R. D., Bergamo, T. F., Joyce, C. B., & Sepp, K. (2021). Machine Learning Classification and Accuracy Assessment from High-Resolution Images of Coastal Wetlands. Remote Sensing, 13(18), 3669. https://doi.org/10.3390/rs13183669
-
9.Matarira, D., Mutanga, O., & Naidu, M. (2022). Google Earth Engine for Informal Settlement Mapping: A Random Forest Classification Using Spectral and Textural Information. Remote Sensing, 14(20). https://doi.org/10.3390/rs14205130
-
10.Mohammadpour, P., Viegas, D. X., & Viegas, C. (2022). Vegetation Mapping with Random Forest Using Sentinel 2 and GLCM Texture Feature—A Case Study for Lousã Region, Portugal. Remote Sensing, 14(18). https://doi.org/10.3390/rs14184585
-
11.Montero, D., Aybar, C., Mahecha, M. D., Martinuzzi, F., Söchting, M., & Wieneke, S. (2023). A standardized catalogue of spectral indices to advance the use of remote sensing in Earth system research. Scientific Data, 10(1). https://doi.org/10.1038/s41597-023-02096-0
-
12.Stark, T., Wurm, M., Zhu, X. X., & Taubenbock, H. (2020). Satellite-Based Mapping of Urban Poverty with Transfer-Learned Slum Morphologies. IEEE Journal of Selected Topics in Applied Earth Observations and Remote Sensing, 13, 5251–5263. https://doi.org/10.1109/JSTARS.2020.3018862
-
13.Wei, X., Zhang, W., Zhang, Z., Huang, H., & Meng, L. (2023). Urban land use land cover classification based on GF-6 satellite imagery and multi-feature optimization. Geocarto International, 38(1). https://doi.org/10.1080/10106049.2023.2236579
-
14.Wolff, E., & Ramírez-Lovering, D. (2022). Living with Floods in Informal Settlements: Compounding and Cascading Risks in Makassar, Indonesia (pp. 161–181). https://doi.org/10.1007/978-981-19-2428-6_9
-
15.Zhao, Z., Islam, F., Waseem, L. A., Tariq, A., Nawaz, M., Islam, I. U., Bibi, T., Rehman, N. U., Ahmad, W., Aslam, R. W., Raza, D., & Hatamleh, W. A. (2024). Comparison of Three Machine Learning Algorithms Using Google Earth Engine for Land Use Land Cover Classification. Rangeland Ecology & Management, 92, 129–137. https://doi.org/10.1016/j.rama.2023.10.007

![[GEODATA] Tutupan Lahan Indonesia](https://mapidstorage.s3.amazonaws.com/general_image/mapidseeit/1684312961161_COVER%20GEODATA_%20Tutupan%20Lahan.png)
![[GEODATA] Status Ekonomi dan Sosial (SES) Indonesia](https://mapidstorage.s3.amazonaws.com/general_image/mapidseeit/1693454652933_20230831-085941.jpg.jpeg)
![[GEODATA] Point of Interest (POI)](https://mapidstorage.s3-ap-southeast-1.amazonaws.com/foto_doc/mapidseeit/doc_1648452337_d8074cde-5aef-4820-88ba-b6cc500a7e04.jpeg)